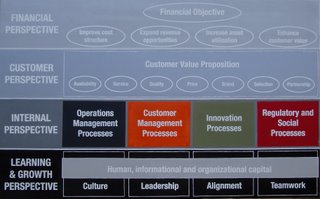
About the generic Balanced Scorecard Strategy Map
In « Strategy Maps » (2004), Robert S. Kaplan and David P. Norton, described how a strategy map represents the way an oranisation creates values, and how such a dynamic visual tool can help describe and communicate strategy, by identifying the key internal processes that drive strategic success, aligning investments in people, technology and organizational capital for the greatest impact, exposing gaps in the strategies and take early corrective action. Norton and Kaplan state that each organization should have its specific and unique strategy map. The strategy map represented here is based on the generic model founded in the four balanced scorecard perspectives; finance, customer, process and learning & growth.
Characteristics painting 9-S-3-A-E
Dimensions: 90 x 144 x 3.5 cm
Colourscheme: 3
Lettertype: Arial
Language: English

Painting 9-S-3-A-E © 060510, BUTRAS
Characteristics painting 9-S-5-H-E
Dimensions: 90 x 144 x 3.5 cm
Colourscheme: 4
Lettertype: Helvetica
Language: English
Painting 9-S-5-H-E © 070326, BUTRAS
Characteristics painting 9-S-4-H-E
Dimensions: 90 x 144 x 3.5 cm
Colourscheme: 4
Lettertype: Helvetica
Language: English
Painting 9-S-4-H-E © 110905, BUTRAS
Acquired by the Vlerick Management School in 2011
Graphics: Visualizing a theory of implementing strategy
"The use of graphical illustrations is important in the popularization of management concepts such as the BSC. Notably, Kaplan and Norton have used many figures (on average about ten per chapter) in their books to illustrate central ideas. What distinguishes graphics is their way of presenting and eliminating certain gratuitous details that are usually part of written text. The use of graphics in documents is very persuasive, as they redefine space, wiping clean of all irrelevant details‖ and restructuring claims and the objects of the illustration (Myers, 1988, p.239).
The use of graphics greatly contributes to the generalization of a claim. This is because the elimination of gratuitous details is part of the move from the particularity of one observation to the generality of a scientific claim (Myers, 1988, p. 239). In previous chapters, we have discussed how the idea of the BSC was generalized by removing local categories specific to ADI, and replacing them with abstract categories (such as the four perspectives). It is even more persuasive when this is achieved through colourful and simple figures, using arrows and boxes to represent key ideas.
The development of strategy maps has further aided the generalization of the BSC. Strategy maps are presented as a dynamic visual tool to describe and communicate strategy through the display of an organization‘s perspectives, objectives, measures, and the causal linkages between them (Kaplan and Norton, 2004a, p.54). They offer a general visual representation that companies can use to customize their own strategic objectives.
Graphs have a pronounced effect even when the data in them are subjective, qualitative or imaginary and when they are usually based on the known general properties of things (Myers, 1988, p. 248). A strategy map offers a visual representation of the strategy through a single-page view of how objectives in the four perspectives integrate and combine to describe the strategy (Kaplan and Norton, 2004a, p.54). Yet when managers look at a strategy map, it is easy to forget that these objectives (and even the concept of strategy itself) are subjective, typically the product of a struggle over the nature and future of the organization. Strategy maps are inevitably based on the imagination of its authors, but their representation as a fixed visualisation hides the possibility of resistance and that the underlying objectives and strategies can be contested.
Kaplan and Norton (2004a) suggest that explicit visuals displayed through strategy maps are very important in making everyone in the organization see how they fit into the overall strategy. However the details of this proposition have to be imagined by the reader, who must think about the cause-and-effect relationships that the strategy maps are argued to illustrate, and the way they link desired outcomes in the customer and financial perspectives to outstanding performance in critical internal processes (Kaplan and Norton, 2004a, p.55). Formulating cause-and-effect relationships take quite an effort. However, such formulations appear to be more credible through the use of the visualization and mapping process."
(CIMA RESEARCH REPORT: Creating and Popularizing a Global Management
AccountingIdea: The Case of the Balanced Scorecard, p. 65-67)


