Saturday, August 06, 2016

Gilbert Keith Chesterton on Cubism and Diagrams

""Delightful sort of hole this is," he said. "This little dell and river here. It's like those places Stevenson talks about, where something ought to happen."

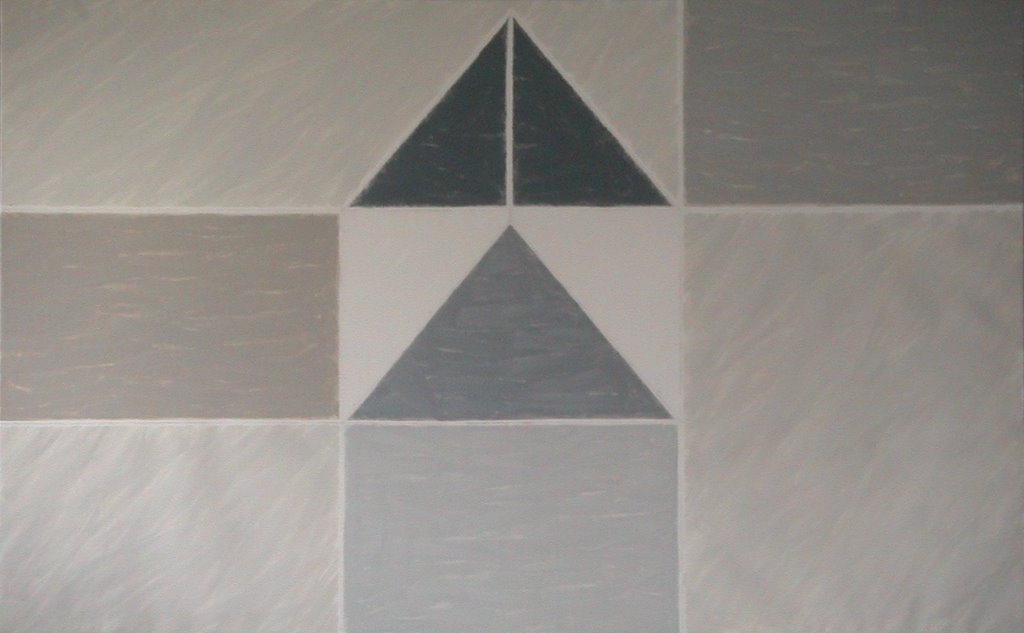
"I know," answered the other. "I think it's because the place itself, so to speak, seems to happen and not merely to exist. Perhaps that's what old Picasso and some of the Cubists are trying to express by angles and jagged lines. Look at that wall like low cliffs that juts forward just at right angles to the slope of turf sweeping up to it. That's like a silent collision. It's like a breaker and the back-wash of a wave."

March looked at the low-browed crag overhanging the green slope and nodded. He was interested in a man who turned so easily from the technicalities of science to those of art; and asked him if he admired the new angular artists.

"As I feel it, the Cubists are not Cubist enough," replied the stranger. "I mean they're not thick enough. By making things mathematical they make them thin. Take the living lines out of that landscape, simplify it to a right angle, and you flatten it out to a mere diagram on paper. Diagrams have their own beauty; but it is of just the other sort. They stand for the unalterable things; the calm, eternal, mathematical sort of truths; what somebody calls the 'white radiance of'—"" (from Chapter 1 of "The Man Who Knew Too Much" by G. K. (Gilbert Keith) Chesterton)

The "somebody" Chesterton refers to is Persy Byssche Shelley. The passage refers to a strophe of the ‘Adonais’ poem.

 "The One remains, the many change and pass;
 Heaven’s light forever shines, Earth’s shadows fly,
 Life, like a dome of many-coloured glass,
 Stains the white radiance of Eternity,
 Until Death tramples it to fragments.—Die,
 If thou wouldst be with that which thou dost seek!
 Follow where all is fled!—Rome’s azure sky,
 Flowers, ruins, statues, music, words, are weak
 The glory they transfuse with fitting truth to speak."

Thursday, November 20, 2014

ITERRATION ZERO

Is the first phase of the ITERRATIO process. It involves the production of a series of paintings, which have been described as "symbolic mirrors of managerial capitalism", and the organisation of related events. The first traces of of the ITERRATIO process date back to 2002 when Christophe de Landtsheer experimented with the graphical representation of concepts.
The first event has been held at the ITERRATIO workshop on Dec 1st 2006.
ITERRATIO@VLERICK is a permanent exhibition of the paintings by Teri Toria is being held as from April 2007
in the Leuven (Belgium) campus of the Vlerick Management School.
In 2011 the Vlerick Management School has acquired five ITERRATION ZERO paintings.
Other events are being planned and will be posted on this blog.
The themes of the works are:
  1. the Generic Strategic Option Model (Christophe de Landtsheer)
  2. the Value Discipline Model (Michael Treacy & Fred Wiersema)
  3. the Stakeholder Dart Board (Christophe de Landtsheer)
  4. the Competitive Advantage Model (Michael E. Porter)
  5. the Performance Prism (Cranfield Business School)
  6. the Organic Growth Model (Christophe de Landtsheer)
  7. the Strategy Map (David P. Norton & Robert S. Kaplan)
  8. the Five Forces Model (Michael E. Porter)
  9. the Blue Ocean Strategy (W. Chan Kim and Renée Mauborgne)
  10. the Red Ocean Strategy (W. Chan Kim and Renée Mauborgne)

NOTE ON THE NAMES OF THE WORKS
The works have names composed of a combination of at least three numbers and letters.
Legend:
  • first number: theme of the work
  • first letter: size of the work
  • second number: colour scheme
  • second letter: font
  • third letter: language
CONTACT : metateri at gmail dot com

Saturday, September 22, 2012

The divulgation of "V 2012"

De Vlerick Business School bestelde het schilderij “V 2012” als commemoratieve onderlijning van de grote vormelijke en strategische veranderingen die de instelling in 2012 doorvoert. De opdracht werd toevertrouwd aan “huisartist” TERI TORIA (het pseudoniem waarachter de samenwerking tussen Yvo D'Herde en Christophe de Landtsheer schuilt), die ook de schilderijen realiseerde die in de campus Leuven te beschouwen zijn.


Het middelgrote werk is een langwerpige horizontale rechthoek (81 x 146 cm) en symboliseert de evolutie van de Vlerick Management School, die in 1958 gesticht werd door professor André Vlerick. Het linker kwart van het schilderij verbeeldt het verleden en bevat het portret van een naar de toekomst blikkende baron Vlerick. In dit deel van het werk overheersen de oude logokleuren van de school, groen en oranje. Dit vlak raakt een oranjerood overgangsvlak in de vorm van een drietal in 63° uitgesneden V's. De woelige penseelvegen in deze zone symboliseren de overgangsperiode die de school onlangs doormaakte. De blik van de stichter is gericht naar een constellatie van proceschartingtekens gepenseeld op de rode achtergrond van een vlak dat zich ontwikkelt van een luchtig vermiljoen naar een diep karmijn. De procestekens zijn ingekleurd in de felle tinten van de nieuwe huisstijl van de school en verwijzen naar de sprankelende teamgeest die de school uitstraalt en wil doorgeven. Het geheel wordt ondersteund door een strak cirkelsegment dat een paarsgekleurde vlak omlijnt. Het paarse vlak suggereert de aardsfeer en is een beeld voor het open perspectief van de Vlerick Management School op de zich internationaliserende wereld.
De felle kleuren van het werk werden gekozen om zich in de nieuwe huisstijl van de gebouwen in te passen. Het formaat werd gekozen om de plaatsing van het werk in de verschillende campi van de school mogelijk te maken.
TERI TORIA is er in geslaagd om in deze opdracht zowel de waarden als de op een rijke traditie gestoelde ambities van de Vlerick Management School op een hedendaagse wijze weer te geven in een werk waarvan de technische en compositorische kwaliteiten eenieder kunnen aanspreken.

Sunday, April 08, 2007

ITERRATIO@VLERICK

Is a permanent exihibition of the works of Teri Toria being held at the Leuven campus of the Vlerick Management School (Vlamingenstraat 83, 3000 Leuven, Belgium).

3-L-1-A-E at minus one © 070405, CdL

The buiding is open to the public every day between 8 AM and 7 PM.

9-S-3-A-E at plus two © 070405, CdL


10-S-3-A-D in the entrance hall © 070405, CdL


Saturday, April 07, 2007

Teri Toria

Teri Toria is the artist who signs the works of the ITERRATION ZERO process.


Thematically works of ITERRATION ZERO comprehend the representation of both generic strategy models and organisation specific schemes, such as, organisational charts, strategy maps, processes, value chains, production and supply chains, etc... In more recent work Teri Toria is painting "company portraits" and concentrates on the representation of virtues and (corporate) values.

The ITERRATIO process has been in gestation since several years. The earliest traces date from 2002.


Thursday, February 22, 2007

13. Blue Ocean Strategy (W. Chan Kim & Renée Mauborgne)

W. Chan Kim and Renée Mauborgne use the terms Red and Blue Oceans to denote the market universe. They claim that a Blue Ocean Strategy is a way to make the competition irrelevant by creating a leap in value for both the company and its customers; it is a market creating strategy. In Blue Oceans, competition is transcended because the rules of the game of a new market are waiting to be set.
"Blue Ocean" and "Red Ocean" © 070422, Distrifina SA


Red Oceans are all the industries in existence today – the kno
wn market space. In the Red Oceans, industry boundaries are defined and accepted, and the competitive rules of the game are known. Here companies try to outperform their rivals to grab a greater share of existing demand. As the market space gets crowded, prospects for profits and growth are reduced. Products become commodities, and cutthroat competition turns the red ocean bloody. Hence, the term “Red” Oceans.

About the Blue Ocean Strategy. Visit the Blue Ocean Strategy web site.


Study for painting 13-M-6 "Blue Ocean" © 070222, Distrifina SA
Study for painting 14-M-6 "Red Ocean" © 070222, Distrifina SA

Sunday, May 21, 2006

12. Generic External Growth Model

In contrast to organic growth strategies, external growth strategies achieve their aims by acquisition of existing assets. Their success is measured by increasing the combined reported value of these assets through the creation of synergetic benefits. The generation of these benefits is dependent on the product, technology, market and intangible compatibility of the old and newly acquired assets.

Characteristics painting 12-S-3-A-F
Dimensions: 90 x 144 x 3.5 cm
Colourscheme: 3
Lettertype: Arial
Language: French

Painting 12-S-3-A-F © 060510, Distrifina SA

Monday, April 24, 2006

11. The Five Forces Model (Michael E. Porter)

This elegant competitive analysis tool can be used to formulate organic growth strategies, as well as to assess the attractiveness of other activities and their potential for external expansion. A sector's attractiveness and the conditions for survival in it are preconditioned by five competitive forces exerted by five types of competitive actors.


More on Michael E. Porter

Characteristics painting 11-S-3-A-E
Dimensions: 90 x 144 x 3.5 cm
Colourscheme: 3
Lettertype: Arial
Language: English


Painting 11-S-3-A-E © 060510, Distrifina SA

Sunday, April 23, 2006

10. Generic Value Chain Integration Model

The horizontal axis of integration is the value chain; from components to consumer. The vertical axis of integration allows to define an activity position relative to the value chain; from the production of raw materials to the provision on customer oriented services. Both horizontal and vertical integration policies can inspire organic as well as external growth strategies.
About Value Chain Integration

Characteristics painting 10-S-3-A-D
Dimensions: 90 x 144 x 3.5 cm
Colourscheme: 3
Lettertype: Arial
Language: Dutch


Painting 10-S-3-A-D © 060510, Butras

Note: an interesting aspect of this model is that it can be immediately related to Roman Jakobson's structural linguistics. Horizontal integration corresponds to the paradigmatical or metaphoric axis, and vertical integration to the syntagmatical or metonymic axis of language. In linguistic terms, a paradigmatical strategy is based on similarity and aims at selection and substitution, whereas a syntagmatical strategy stems from proximity or contiguity and aims at combination and articulation.

Saturday, April 22, 2006

9. The Generic BSC Strategy Map (David P. Norton & Robert S. Kaplan)

About the generic Balanced Scorecard Strategy Map
In « Strategy Maps » (2004), Robert S. Kaplan and David P. Norton, described how a strategy map represents the way an oranisation creates values, and how such a dynamic visual tool can help describe and communicate strategy, by identifying the key internal processes that drive strategic success, aligning investments in people, technology and organizational capital for the greatest impact, exposing gaps in the strategies and take early corrective action. Norton and Kaplan state that each organization should have its specific and unique strategy map. The strategy map represented here is based on the generic model founded in the four balanced scorecard perspectives; finance, customer, process and learning & growth.


More about the Strategy Map
Characteristics painting 9-S-3-A-E
Dimensions: 90 x 144 x 3.5 cm
Colourscheme: 3
Lettertype: Arial
Language: English

Painting 9-S-3-A-E © 060510, BUTRAS


Characteristics painting 9-S-5-H-E
Dimensions: 90 x 144 x 3.5 cm
Colourscheme: 4
Lettertype: Helvetica
Language: English

Painting 9-S-5-H-E © 070326, BUTRAS

Characteristics painting 9-S-4-H-E
Dimensions: 90 x 144 x 3.5 cm
Colourscheme: 4
Lettertype: Helvetica
Language: English


Painting 9-S-4-H-E © 110905, BUTRAS
Acquired by the Vlerick Management School in 2011


Graphics: Visualizing a theory of implementing strategy


"The use of graphical illustrations is important in the popularization of management concepts such as the BSC. Notably, Kaplan and Norton have used many figures (on average about ten per chapter) in their books to illustrate central ideas. What distinguishes graphics is their way of presenting and eliminating certain gratuitous details that are usually part of written text. The use of graphics in documents is very persuasive, as they redefine space, wiping clean of all irrelevant details‖ and restructuring claims and the objects of the illustration (Myers, 1988, p.239).

The use of graphics greatly contributes to the generalization of a claim. This is because the elimination of gratuitous details is part of the move from the particularity of one observation to the generality of a scientific claim (Myers, 1988, p. 239). In previous chapters, we have discussed how the idea of the BSC was generalized by removing local categories specific to ADI, and replacing them with abstract categories (such as the four perspectives). It is even more persuasive when this is achieved through colourful and simple figures, using arrows and boxes to represent key ideas.

The development of strategy maps has further aided the generalization of the BSC. Strategy maps are presented as a dynamic visual tool to describe and communicate strategy through the display of an organization‘s perspectives, objectives, measures, and the causal linkages between them (Kaplan and Norton, 2004a, p.54). They offer a general visual representation that companies can use to customize their own strategic objectives.
Graphs have a pronounced effect even when the data in them are subjective, qualitative or imaginary and when they are usually based on the known general properties of things (Myers, 1988, p. 248). A strategy map offers a visual representation of the strategy through a single-page view of how objectives in the four perspectives integrate and combine to describe the strategy (Kaplan and Norton, 2004a, p.54). Yet when managers look at a strategy map, it is easy to forget that these objectives (and even the concept of strategy itself) are subjective, typically the product of a struggle over the nature and future of the organization. Strategy maps are inevitably based on the imagination of its authors, but their representation as a fixed visualisation hides the possibility of resistance and that the underlying objectives and strategies can be contested.
Kaplan and Norton (2004a) suggest that explicit visuals displayed through strategy maps are very important in making everyone in the organization see how they fit into the overall strategy. However the details of this proposition have to be imagined by the reader, who must think about the cause-and-effect relationships that the strategy maps are argued to illustrate, and the way they link desired outcomes in the customer and financial perspectives to outstanding performance in critical internal processes (Kaplan and Norton, 2004a, p.55). Formulating cause-and-effect relationships take quite an effort. However, such formulations appear to be more credible through the use of the visualization and mapping process."

(CIMA RESEARCH REPORT: Creating and Popularizing a Global Management
AccountingIdea: The Case of the Balanced Scorecard, p. 65-67)

Tuesday, March 21, 2006

8. The Organic Growth Model (Christophe de Landtsheer)

About the Organic Growth Model
Because they have insufficient access to capital to extend their activity externally (by acquiring external assets), the vast majority of companies and business units have no option but to focus on an organic growth strategy.
In most strategies "cash is king", in organic growth strategies this factor is the most extremely salient. 99 % of humanity is living and working in this strategic mode. And yet, not a lot of models are specifically focusing on it.
Growing and keeping cash flow and reserves in balance is the challenge here. And as growth means investing, it is of the utmost importance to focus on discretionary spending which either enables the organisation to perform better (process improvement) or increases its competitive position by executing its strategy effectively.It's all about the fine alchemy of combining the right doses of diversification and differentiation.
This model is dedicated to all the inventive and hard working people on this earth.

Characteristics painting 8-M-2-A-E
Dimensions: 120 x 192 x 3.5 cm
Colourscheme: 2
Lettertype: Arial
Language: English


Painting 8-M-2-A-E © 060321, Distrifina SA

Saturday, March 11, 2006

7. The Performance Prism (Cranfield Business School)

About the Performance Prism

More on the Performance Prism

Characteristics painting 7-M-2-A-E
Dimensions: 120 x 192 x 3.5 cm
Colourscheme: 2
Lettertype: Arial
Language: English

Painting 7-M-2-A-E © 060311, Distrifina SA

Friday, March 10, 2006

6. The Product / Market Matrix (Igor Ansoff)

Igor Ansoff created the Product / Market diagram in 1957 as a method to classify options for business expansion. The beauty of this model is that the four strategic options defined can be generically applied to any industry.


More on the Product / Market Matrix
More on Igor Ansoff

Characteristics painting 6-M-2-A-E
Dimensions: 120 x 192 x 3.5 cm
Colourscheme: 2
Lettertype: Arial
Language: English

Painting 6-M-2-A-E © 060306, Distrifina SA

Thursday, March 09, 2006

5. The Competitive Advantage Model (Michael E. Porter)

About the Competitive Advantage Model

More on Michael E. Porter

Characteristics painting 5-M-2-A-G
Dimensions: 120 x 192 x 3.5 cm
Colourscheme: 1
Lettertype: Arial
Language: German


Painting 5-M-2-A-G © 060306, Distrifina SA

Wednesday, March 08, 2006

4. Stakeholder Dart Board (Christophe de Landtsheer)

About the Stakeholder Dart Board

There has been a lot of discussion lately about corporate governance. Not only about fraudulent CEOs, but also on who should be taken account running a business, and how. The Stakeholder Dart Board Model offers a generic answer to such questions. Who are an organisation's stakeholders? In how far should their legitimate expectations be weighed against the organisation's valid interests? These are dynamic issues which should carefully be managed by any organisation, whether for profit or not, privately owned or publicly quoted.
The Stakeholder Dart Board is not only an effective way to keep track of the agendas of the multiplicity of stakeholder segments, but also to make sure the stakeholder satisfaction / expectation balance remains in favour of the organisation and in alignment to its strategy.

In relation to stakeholder mangement, also see The Performance Prism

Characteristics painting 4-L-1-H-E
Dimensions: 150 x 242 x 4.5 cm
Colourscheme: 1
Lettertype: Arial
Language: English

Painting 4-L-1-H-E (unfinished) © 060619, Distrifina SA

Painting 4-L-1-H-E (finished) © 070326, Distrifina SA

3. The Value Disciplines Model (Michael Treacy & Fred Wiersema)

This excellence model stresses the importance of focusing the organisation on developing one unmatched value proposition, while keeping sufficient attention on other value disciplines in order to maintain general competitiveness. The two central triangles have been added to link the model to consequential actions to be taken in the area of business process management.
About the Value Disciplines Model


More on Michael Treacy and Fred Wiersema

Characteristics painting 3-L-1-A-E
Dimensions: 150 x 242 x 4.5 cm
Colourscheme
: 1
Lettertype: Arial
Language: English


Painting 3-L-1-A-E © 060224, butras
Acquired by the Vlerick Management School in 2011

Prof. dr. Marc Buelens and dr. Annick Van Rossem
posing in front of 3-L-1-A-E